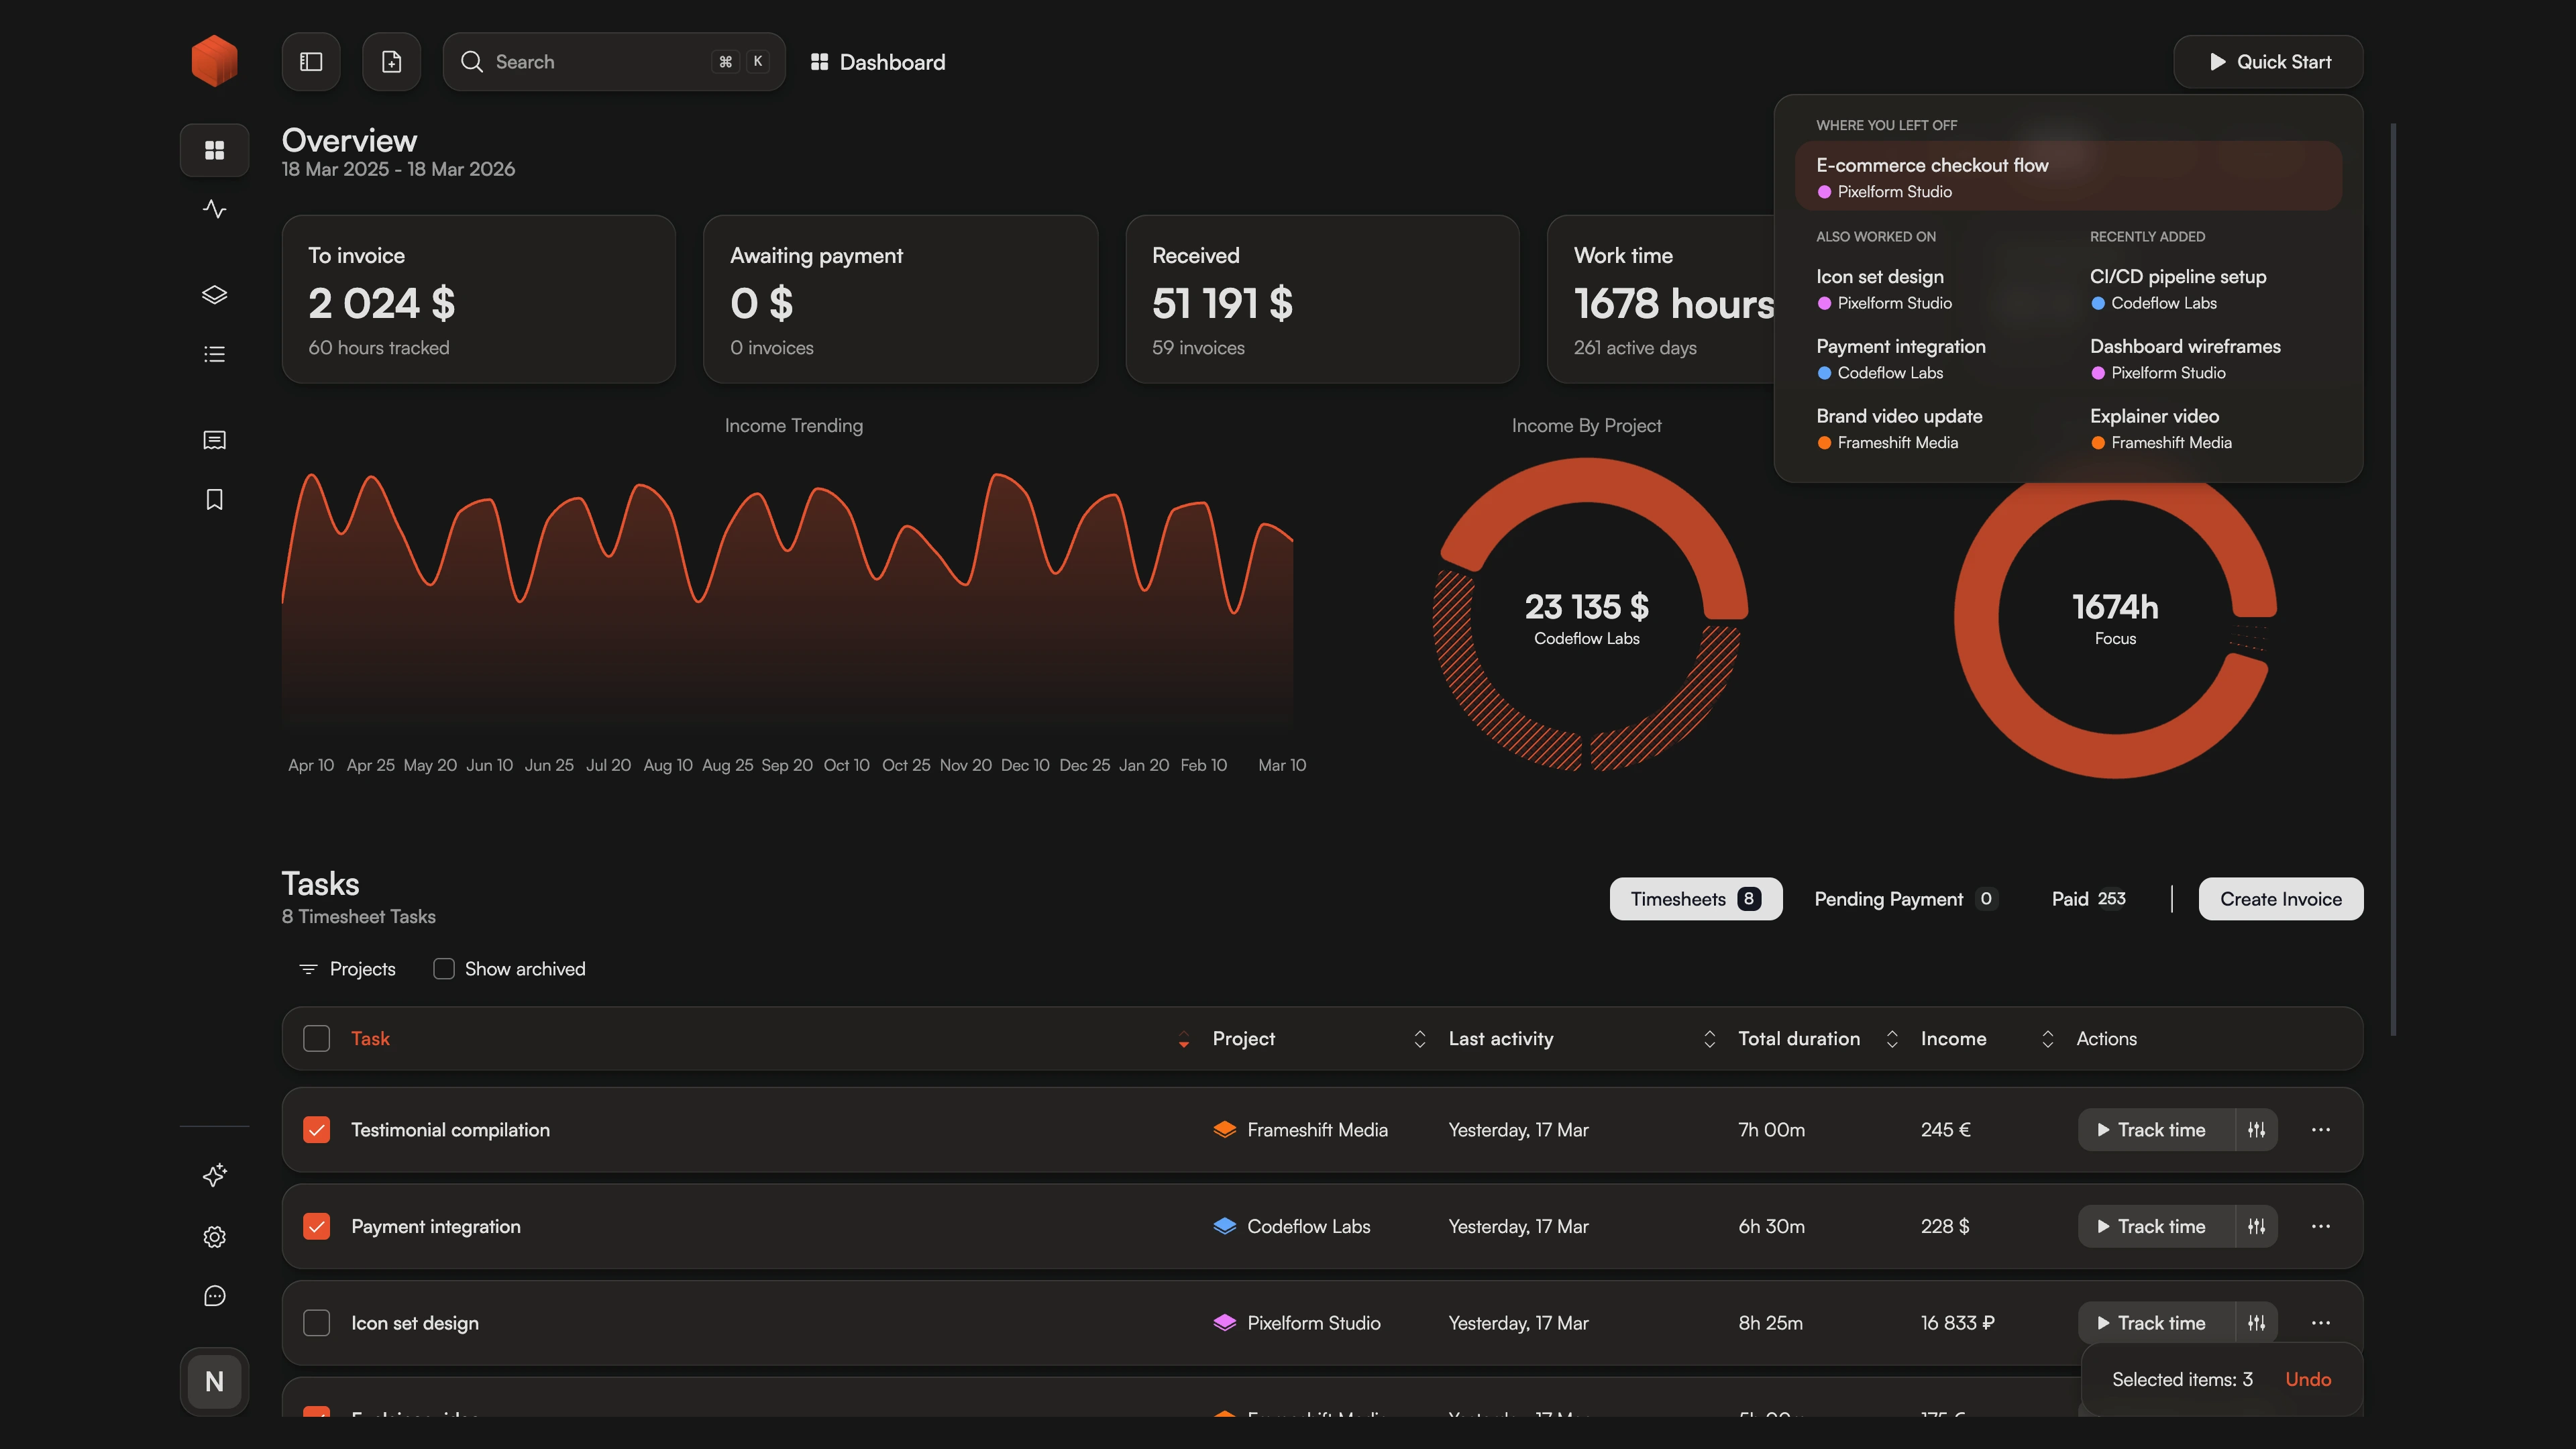
- Know your revenue in real-time
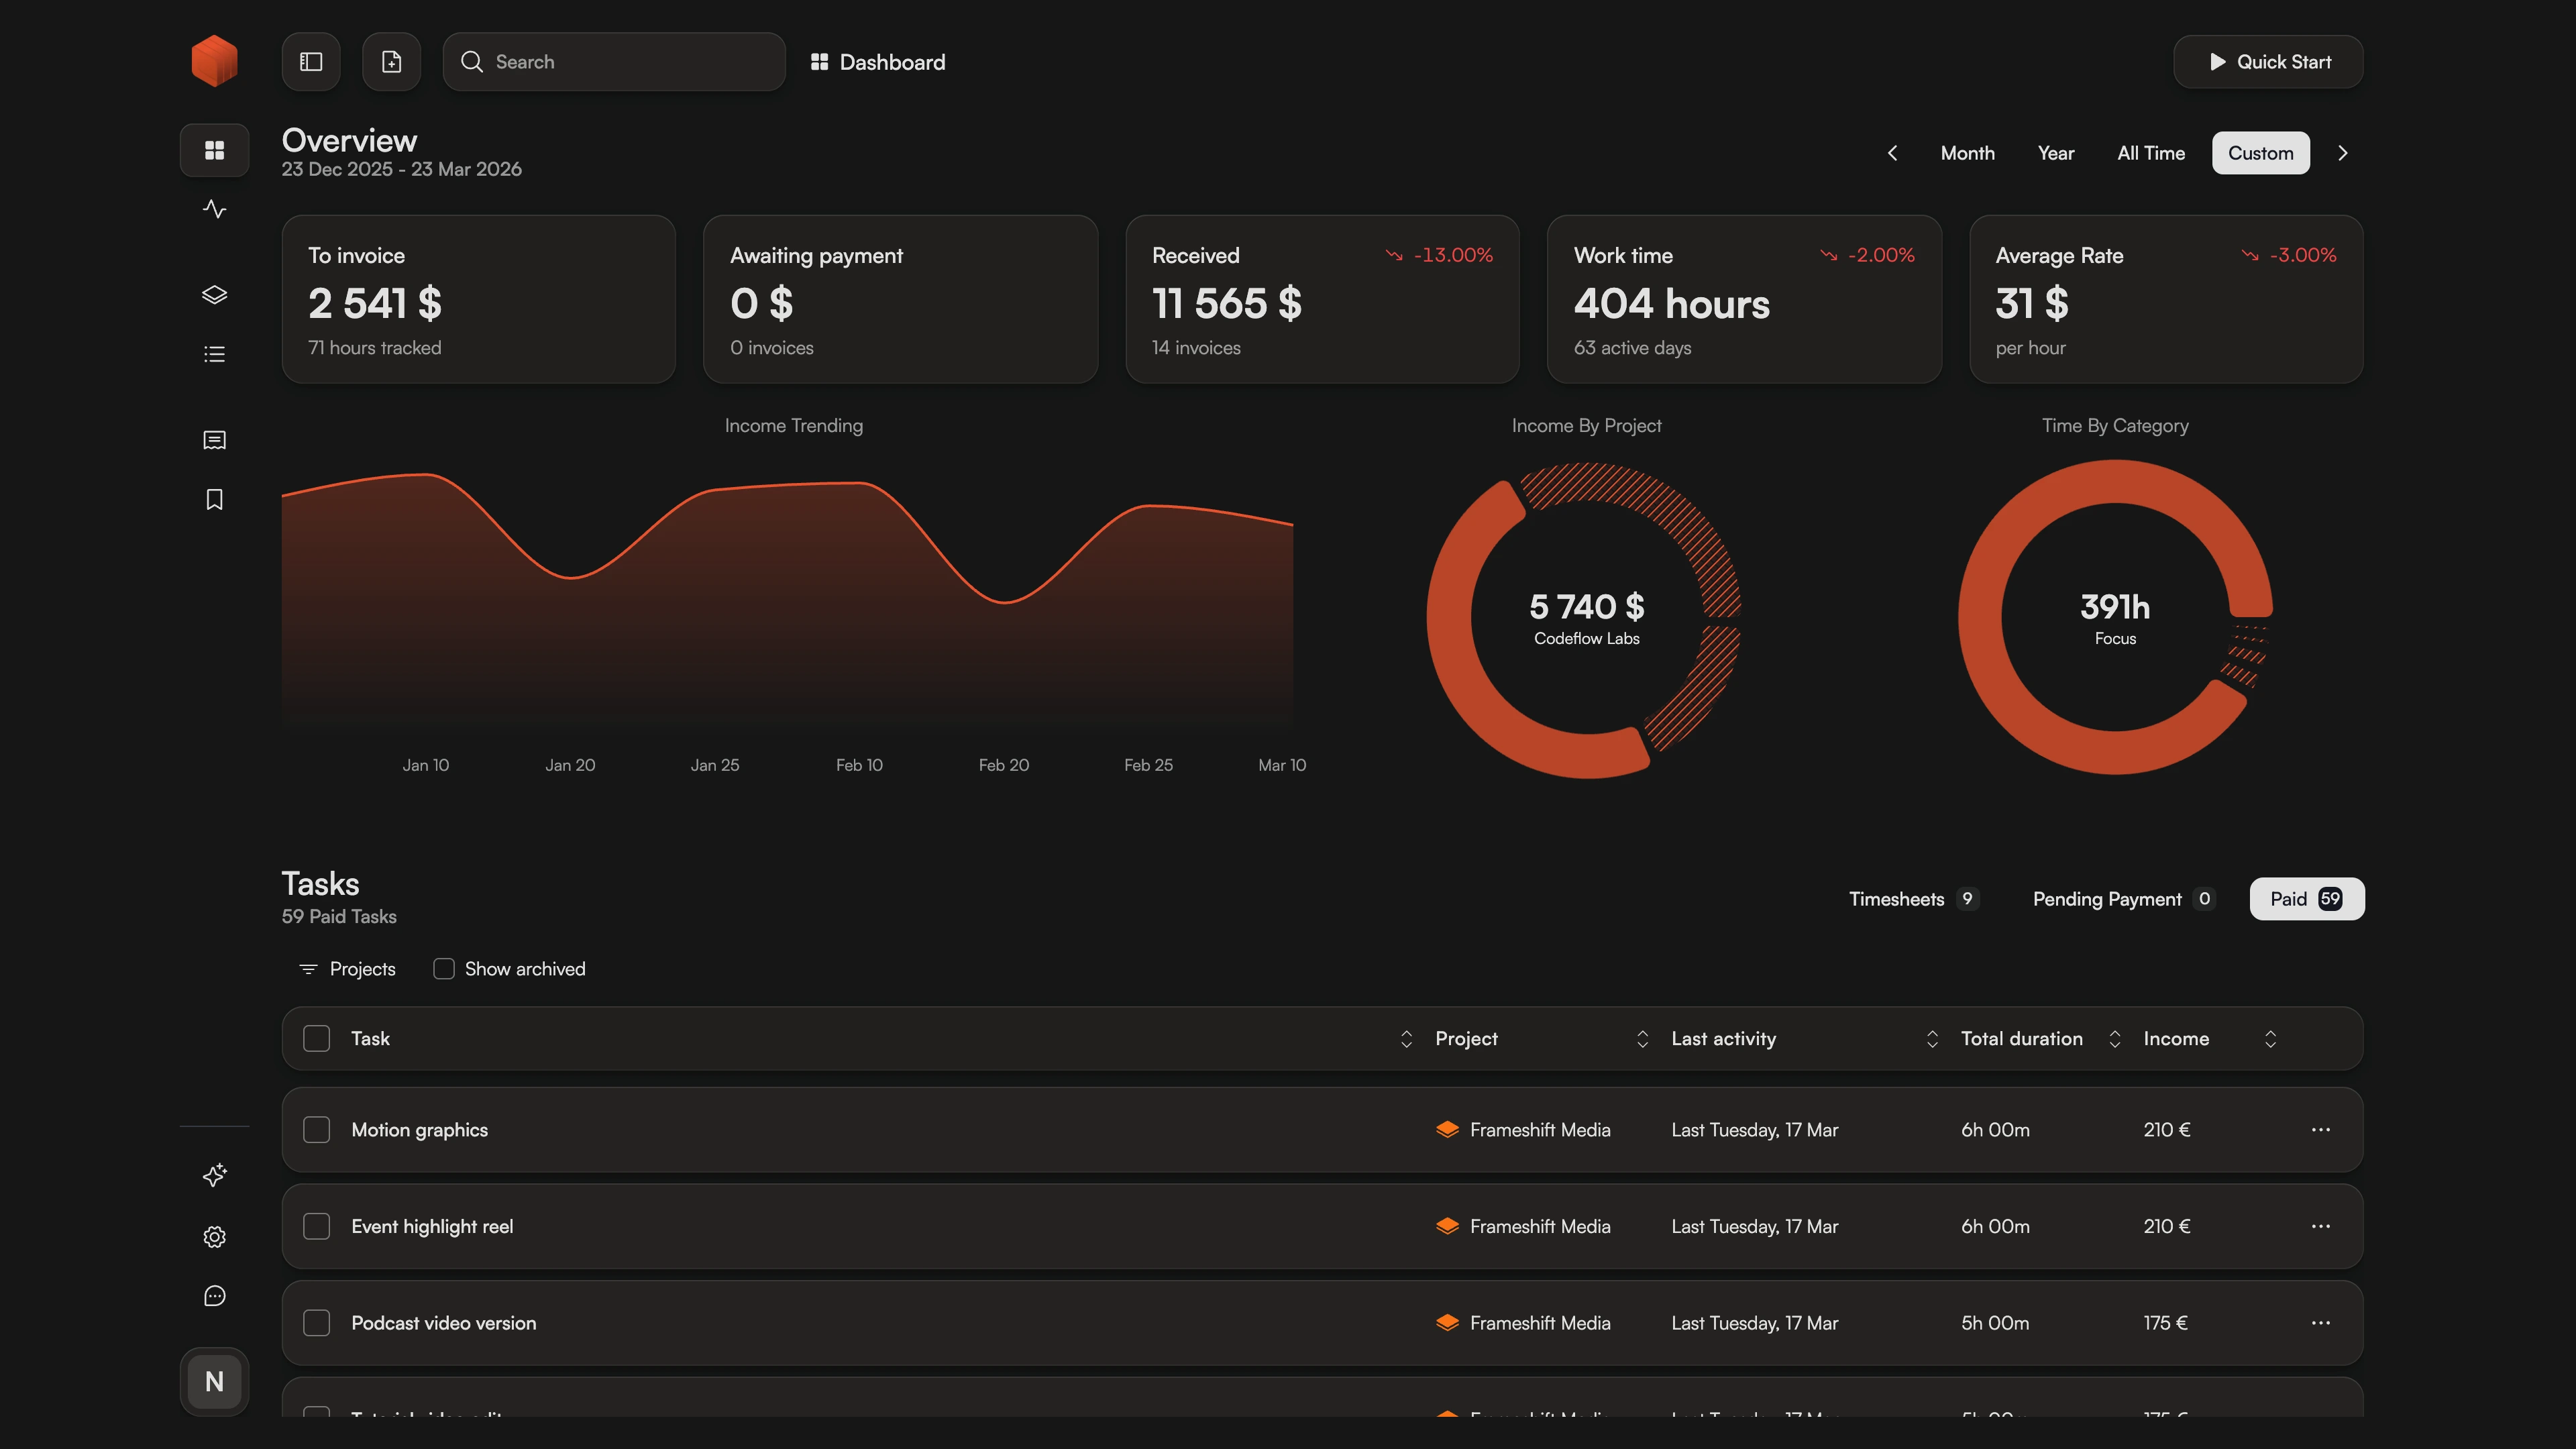
- See where your time goes
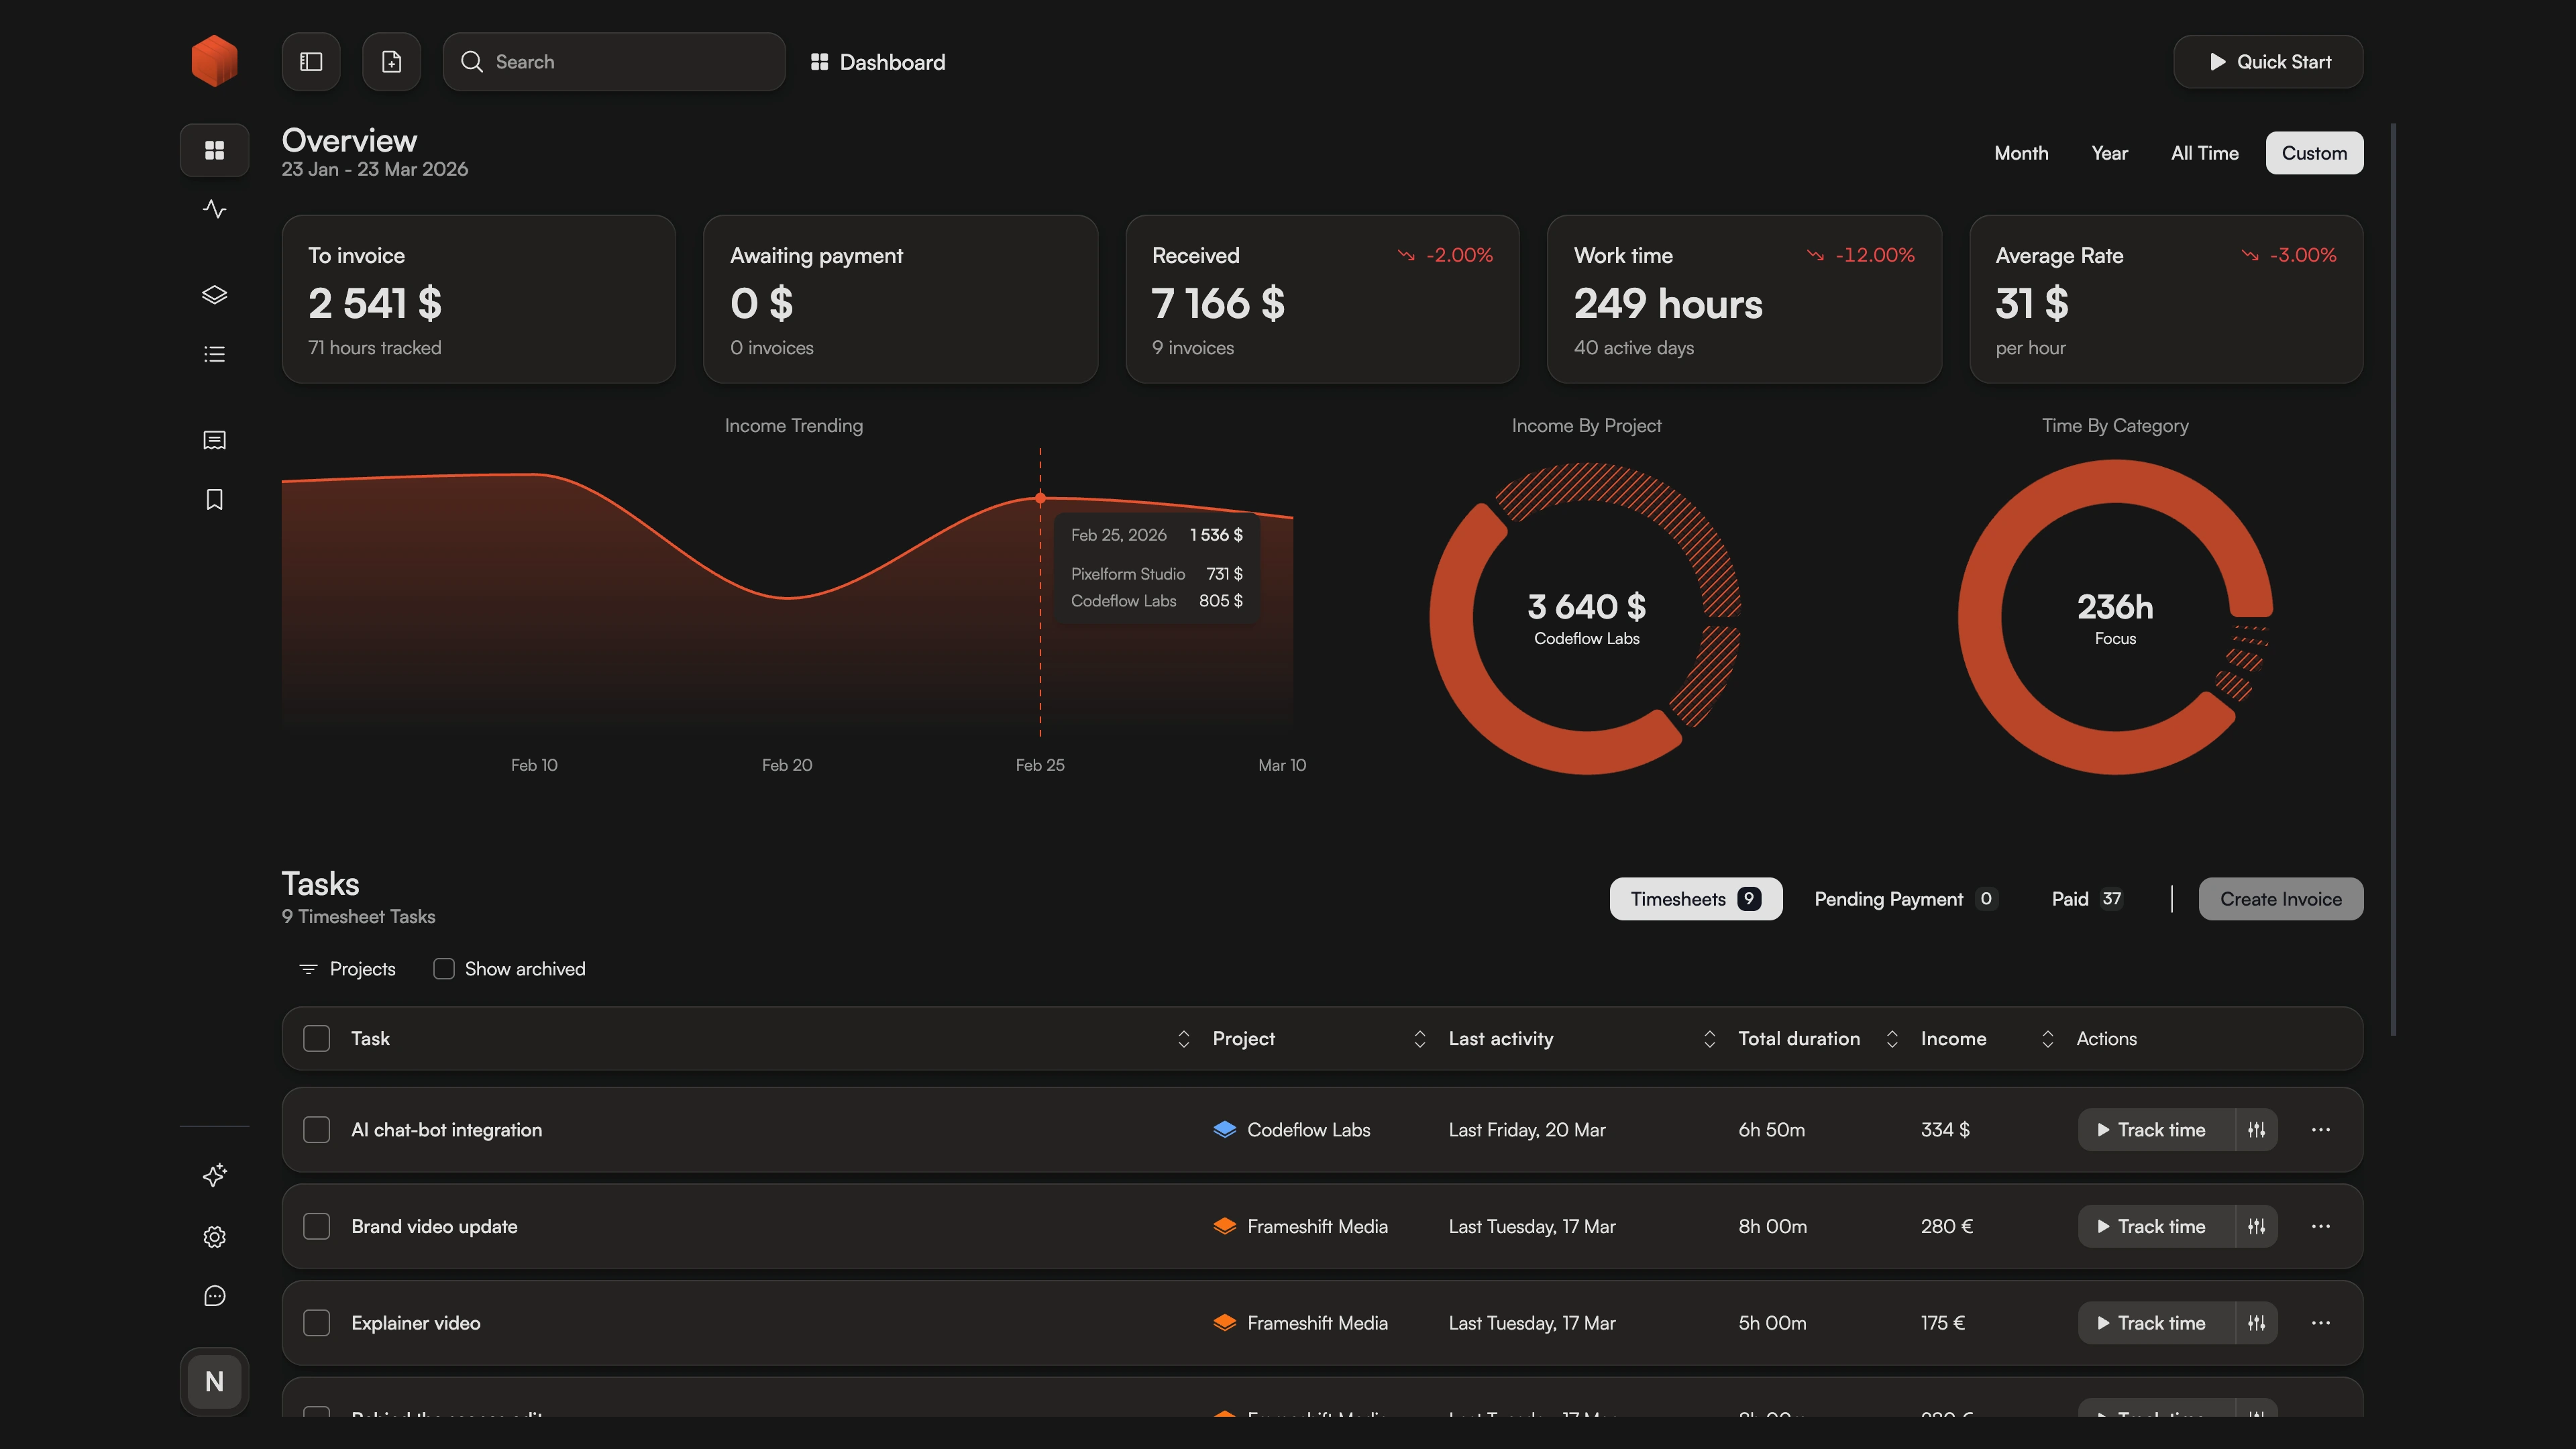
- Spot trends before they hurt
Freelance Time Tracking Dashboard for Real Business Insights
Stop flying blind. Chronum's analytics dashboard turns your raw activity timeline into actionable data. Monitor revenue, compare performance, and see exactly where your time goes with a high-performance, native interface.
From Hours Worked to Business Insights
Most freelancers know exactly how many hours they worked today. But ask them about their monthly revenue trend or which client consumes the most time for the least return—and they're lost. This "Big Picture" blindspot is dangerous. Without it, you can't raise your rates strategically, identify unprofitable clients, or plan for seasonal dips.
Chronum's Analytics Dashboard gives you the CFO-level view of your freelance business. By aggregating your tracked sessions into visual KPIs, we help you spot patterns, compare periods, and make data-driven decisions. It's not just about tracking time—it's about understanding where your business is going.
Critical Metrics, Zero Latency
See your total billable hours and revenue as they happen. Because Chronum is a native desktop app, the dashboard updates the seconds you stop your timer. No refreshing pages—just instant financial clarity.
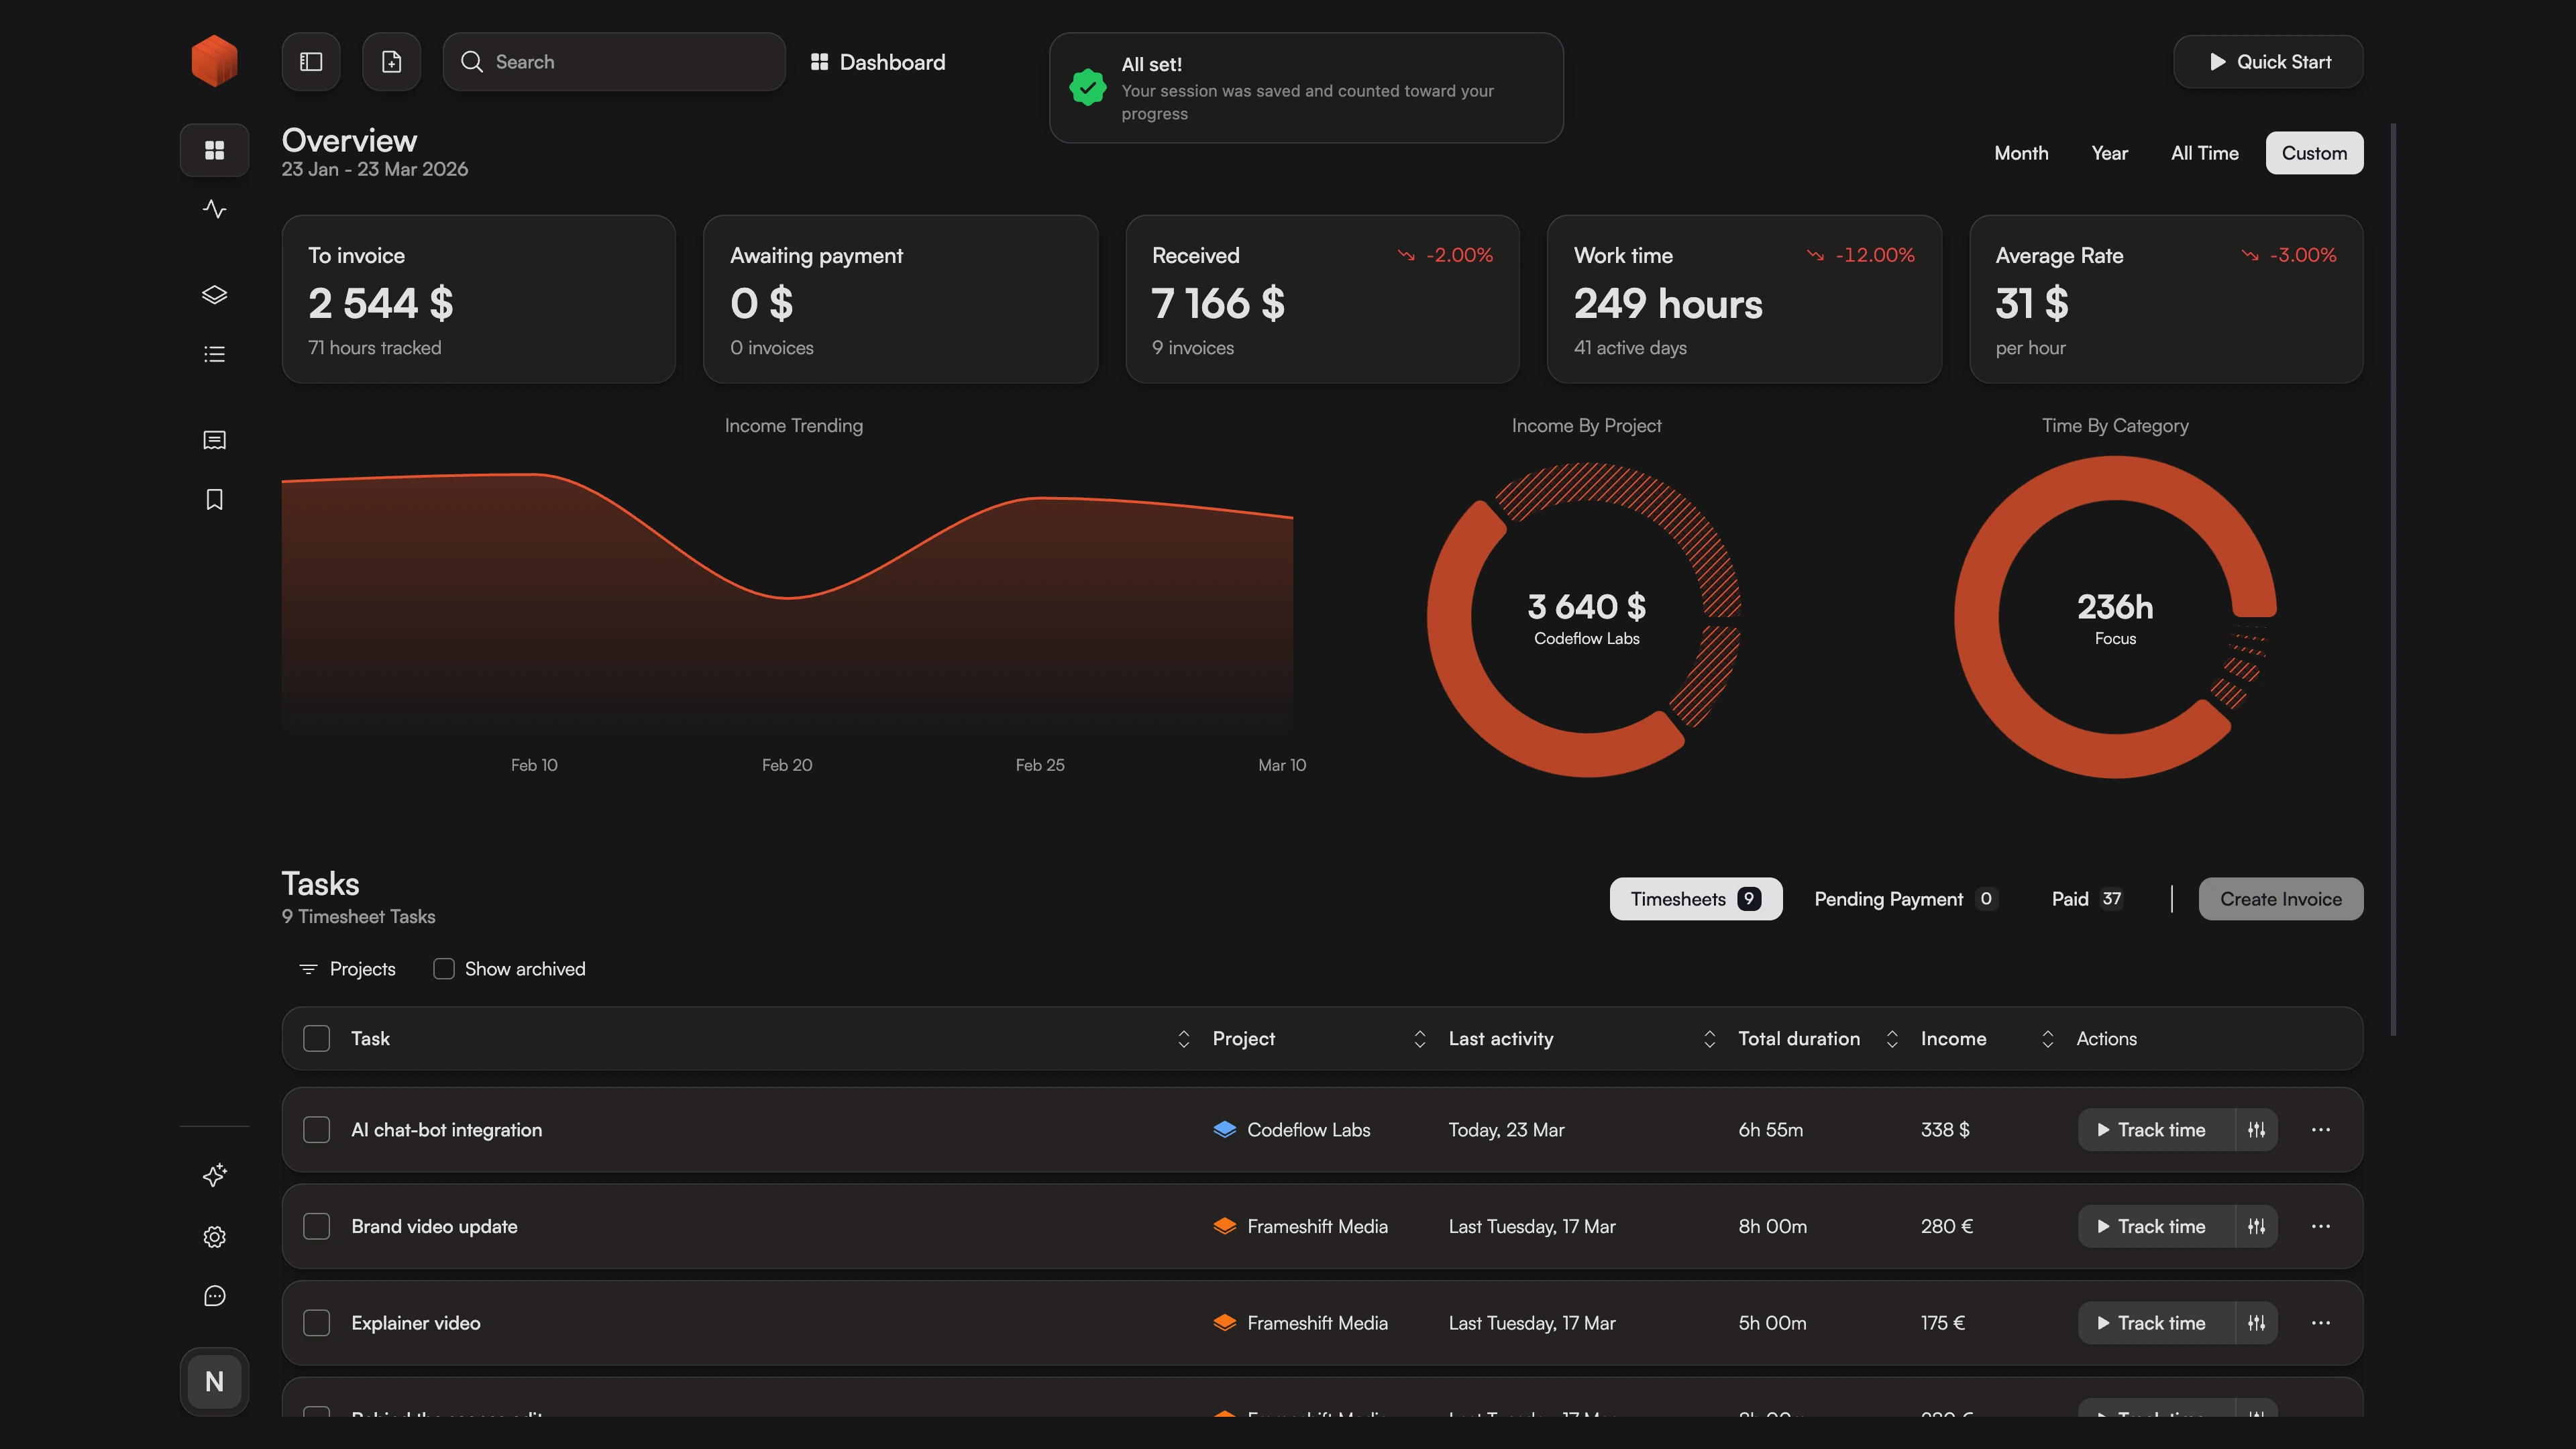
Spot Patterns Before They Become Problems
Compare this month's performance against the last. Our trend charts help you visualize your work-life balance and revenue growth. Identify seasonal dips or "crunch periods" across all your multi-currency projects with ease.
Total Clarity, No Switching Tabs
Stop jumping between reports to understand your numbers. Chronum's dashboard provides a synchronized view: monitor your high-level revenue trends at the top, and scroll down to see the exact tasks driving those metrics. It's the perfect middle ground between a financial summary and your detailed activity timeline.
Frequently Asked Questions
Stop guessing. Start growing.
Get the dashboard view of your freelance business.